A Basic Strategy
Model Backtest:
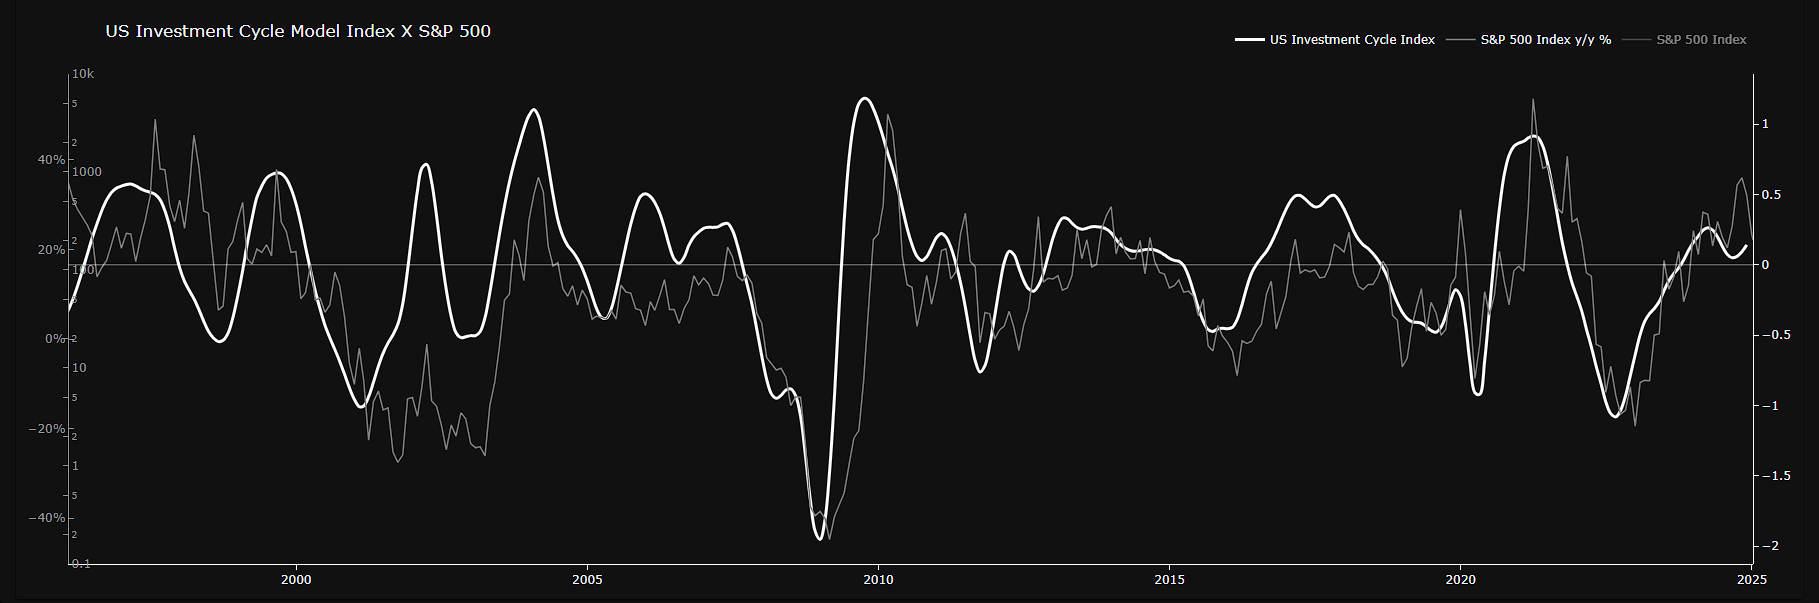
US Investment Cycle
Identify a baseline strategy as defined below, based on the US Investment Cycle Model. The accompanying tiles, featuring charts for Time at Risk, Drawdown, and Performance, provide a comparative analysis of the strategy against a Buy & Hold approach to the S&P 500 over the full timeframe from May 31, 1996, to November 1, 2024.
| Assets: | US Equities S&P 500 with Ticker SPY |
| Direction: | Long equities or No position (cash) |
| Signal 1 (long): | US Investment Cycle Model is signaling RECOVERY, BOOM or SLOWDOWN |
| Signal 2 (cash): | US Investment Cycle Model is signaling RECESSION |
| Starting Portfolio: | 10’000 USD = Portfolio Value 1 |
| Trading Costs: | 0.1 % per Trade |
| Comparison: | Long only S&P 500 (SPY) |
Explore a curated selection of model charts.
Our strategy ensures that the portfolio maintains market exposure for only 71% of the time, in contrast to the benchmark long-only S&P 500 strategy, which sustains a continuous 100% market exposure on the long side.


Final Equity
Time at Risk
25 Years Applied
Trades only
Inputs
Model
With this strategy, drawdown is significantly reduced on a consistent basis.


Drawdown
While the strategy generally achieves a significant reduction in drawdowns during periods of anticipated higher volatility.
In 2002 and 2003, the model—primarily driven by fundamental inputs—was unable to fully account for the widespread market distrust following the dot-com bubble burst.
A market sentiment model, leveraging behavioral and sentiment-based indicators, would be better equipped to capture such dynamics.
Conclusion and Further Remarks
By employing a robust model, market exposure time and drawdowns have been significantly minimized, resulting in enhanced overall performance.
The strategy has executed only 12 trades in total, effectively reducing transaction costs and time commitments.
Performance can be further optimized by, for instance, taking short positions on SPY during recession signals or diversifying into other asset classes. However, it is important to note that these adjustments may introduce additional risk.
The model’s comprehensive reports and charts highlight a range of potential outcomes for each signal phase, offering insights that enhance predictability, return expectations, and time horizons, helping you align your decisions with your specific risk tolerance.
With the strategy, the portfolio has grown more than 35x the initial value, compared to a 14-fold increase if you just held SPY during the entire timeframe

